Friday 11 November 2011

Kilmore Quay, Wexford & Rosslare Surveys

After completing the first survey leg of the 2011 season in Waterford Harbour, the Geological Survey of Ireland's (GSI) 7m RIB (Rigid Inflatable Boat), RV Geo, was taken out of the water in late June and transported by land to Wexford for the second leg - surveys of Wexford Harbour, Kilmore Quay and Rosslare. The latter was predominantly carried out by the GSI's 15m aluminium catamaran, the RV Keary, while the first two areas were mapped solely by the Geo due to their very shallow nature.

Wexford proved to be a highly challenging area to survey, with numerous shallow sand banks forcing the Geo to operate in waters as shoal as 2m. With its fragile transducer hanging 0.6m below the waterline, this required great skill on the part of the skipper to safely manoeuvre the vessel through the shallows. To further complicate matters, the sand banks of Wexford harbour are highly mobile, and so their distribution no longer matched the existing nautical charts - hence the great need for an updated survey of the area.
Along with a requirement for very careful navigation, the survey crew also had to keep a careful watch on the tidal conditions. Due to its shallow nature, safe navigation between the shoals of Wexford harbour is extremely restricted by the tide - in many areas the Geo could only operate at high tide, with some of those areas drying out at lower water levels.


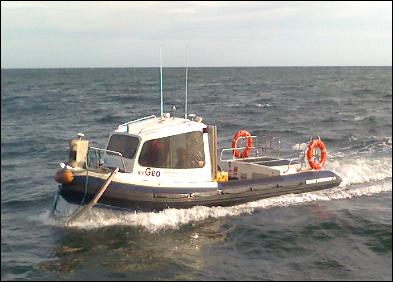
RV Geo on survey operations


RV Keary navigating off the coast

Another feature to note in Wexford harbour was the presence of a large seal colony. Great care was taken not to disturb the creatures during survey operations and so the Geo's surveyor also doubled-up as a marine mammal observer (MMO). In addition to reporting on the survey, the surveyor created an MMO report detailing sightings of the seals - a useful dataset in itself for marine biologists.


Survey area mapped by the RV Geo through Waterford Harbour. The blue end of the colour scale represents deeper water, with the shallow seabed represented as green, through yellow to red.


A large number of seals were observed on the edge of the sandbank in Wexford harbour


In addition to mapping the seabed with sonar, the crew of the RV Geo also collected many sound velocity profile (SVP) data.
The SVP data is necessary because the sonar systems measure the travel time of sound waves through the water. As water temperature and salinity differ from within and between survey areas, so too does the speed of sound. Therefore these effects must be corrected for in order to accurately map the seabed. The SVP data was acquired by lowering a probe down into the water column, measuring the temperature and salinity of the water and therefore providing the survey team with a record of the sound velocity in a given location. By conducting regular sound velocity casts in Wexford harbour, the team ensured that the final dataset would require minimal processing to correct for errors created by the changes in the water column. The advantage of acquiring this data is that the information gathered during the survey constitutes a unique dataset which can have additional use in the study of the local oceanography of the area.


Following the survey of Wexford Harbour, the RV Geo was transited by sea to Rosslare harbour. The RV Keary had commenced survey operations in Rosslare at this point, and both vessels conducted survey operations in the area. The RV Keary conducted the bulk of the survey work, with the Geo briefly carrying out bathymetric mapping.


Survey coverage in Rosslare harbour


Following survey operations in Rosslare, the RV Geo was taken out of the water and transported by land to Kilmore Quay, while the RV Keary remained in Rosslare to continue operations. A similar survey strategy was employed at Kilmore Quay, involving further mapping of the seabed using sonar and SVP data acquisition. A feature of interest off the coast there is St. Patrick's bridge, a ridge of raised seabed that juts southwards. Along with shallow areas near the harbour, this feature could only be crossed by RV Geo at high tide, and so like Wexford this survey also included tidally-restricted areas.


Survey coverage by RV Geo at Kilmore Quay

Thursday 3 November 2011

INIS-Hydro Project

INIS-hydro is a 3 year INTERREG IVA Programme with the Maritime and Coastguard Agency (MCA) in the UK as lead partners. The project brings together 7 partners to conduct hydrographic surveys in Ireland, Northern Ireland and Scotland. The partners are the MCA, Geological Survey of Ireland (GSI), Marine Institute (MI), the Agri-Food and Biosciences Institute (AFBI), the Scotish Association of Marine Science (SAMS), the Northern Lighthouse Board (NLB) and the United Kingdom Hydrographic Office (UKHO).

The surveys will be undertaken in Dundalk Bay, Carlingford Lough, Dundrum Bay, the Firth of Lorn and South West of Islay by several different vessels drawing on expertise from the various partners. The bathymetric data will deliver 3D baseline maps using multibeam echosounder technology which will be freely distributed. The project also plans to harmonise hydrographic survey specifications and synchronisation for future surveys.


Areas of seabed to be mapped during the INISHydro project


These surveys comply with the partners obligations under the Safety of Life at Sea conventions and will be augmented with auxiliary scientific data collected in conjunction with the bathymetric data. Details of the project can be found on the website at http://www.inis-hydro.eu/


The project is essential as the current nautical charts for these areas were produced largely in the 19th century and whilst they were an enormous achievement for the surveyors of their day, these charts are not as reliable as their terrestrial counterparts and warrant updating. The territories to be mapped in the INISHydro project encompass important navigation channels, areas of environmental interest and potential sites for marine renewable energy - it also involves a very significant level of cooperation, bringing together so many partner organisations.


INISHydro partner organisations


In September 2011, three vessels were mobilised to Dundalk Bay to begin mapping the Irish territory – the RVs Keary and Geo were supplied by the GSI and RV Celtic Voyager was provided by the MI.


RV Celtic Voyager


RV Keary


RV Geo


The Voyager carried out bathymetric mapping up to the 10m depth contour, while the Keary and the Geo were assigned to shallow-water mapping up to the 5m and 0m contours, respectively.


While the Voyager operated out of Howth, Co. Dublin, on a 24-hour basis the Keary and the Geo were based locally, carrying out surveys in daylight hours and mooring at Port Oriel overnight.
This was also the location of a tide gauge for the duration of the survey, along with a GPS base station which was deployed at a private residence nearby. The tide gauge provided a record of the tidal changes in the area throughout the survey, which is necessary as the bathymetric data must be corrected for the resulting rise and fall of the survey vessels during their operations. The GPS base station was used to improve the positioning accuracy of the survey data during processing.


Total survey coverage for Dundalk Bay during the 2011 survey.


In addition to bathymetric data, the Keary and the Voyager recorded a sub-bottom profile along each survey line using shallow seismics. East of Dundalk, an interesting channel-like feature was observed in the data, which requires further geological analysis.


Sub-bottom profile showing channel-like feature east of Dundalk Bay


Channel-like feature visible in the Keary's bathymetric data as dark blue strip

Friday 28 October 2011

Maritime Archaeology aboard RV Keary

Since INFOMAR began in 2006, the survey team have regularly supplied data to the Underwater Archaeology Unit (UAU, part of the Department of Arts, Heritage & Gaeltacht) on a variety of shipwrecks that have been surveyed around the Irish coast. The process involves the sharing of detailed sonar data (multibeam and sidescan), which the UAU analyse in order to help ascertain whether a given wreck is known or unknown, whether or not it needs to be protected, and to improve the accuracy of the national shipwrecks database. INFOMAR and the UAU also publish wreck information sheets together, which are available to download at www.infomar.ie – these provide information on the locations of particular wrecks, their water depths, history and any diving information if available.


At the start of August 2011, this partnership was developed further when RV Keary and RV Geo gave support to the UAU in an archaeological excavation of a potential Spanish Armada wreck near Burtonport, Co. Donegal.


The Rutland Island Wreck, named after a nearby island, had been discovered two years previously by local divers, and had already been investigated by the UAU. However, it had not yet been properly excavated, and so the Keary was provided by the Geological Survey of Ireland as a dive platform to facilitate the team of maritime archaeologists in this endeavour.


RV Keary and UAU vessel moored together above the wreck site


Marine archaeologist wearing commercial diving gear, emerging at the stern of RV Keary


The vessel served very well as a base of operations for the team, providing ample space for their specialised diving equipment – tanks and compressors that provided surface-supplied air, and a communications setup that allowed dialogue between the surface team and the divers below. The vessel’s hydraulic A-frame also played a role in recovering some of the UAU’s equipment from the seabed at the end of the project, and several areas were provided on deck for the analysis of recovered artefacts. One of the Keary's instruments, called a USBL (Ultra-Short Base Line), was also used to great effect in pin-pointing locations on the seabed that were of interest to the archaeologists. This is an acoustic transducer, located on a hydraulic drop-pod between the catamaran's hulls, that can communicate with a set of beacons. The divers assembled a metal grid over the wreck in order to assist with mapping of its various timbers and artefacts, and by placing these beacons on its four corners, the Keary's USBL could be used to give accurate coordinates for the grid's location - and therefore accurate positioning for all discovered artefacts. One beacon was also carried by a diver carrying out metal-detection on the seabed around the wreck, which meant the Keary's survey crew could provide him with coordinates for all objects that were discovered this way.


USBL display showing RV Keary at centre and recorded positions of beacons


The Keary also accommodated a variety of film and radio crews, who documented the excavation for privately-funded documentaries and public service broadcasting. All in all, the vessel played host to a huge variety of scientists, archaeologists and journalists over the three week period.


The INFOMAR, UAU and local dive teams aboard RV Keary


In order to establish a semi-permanent base at the site, the Keary was placed over the wreck and anchored at three points to hold her in position, with the Geo remaining mobile in order to ferry survey crew and archaeologists to and from the base of operations, along with carrying out her own bathymetric survey operations (mapping of water depths).


RV Geo carrying out bathymetric survey


The UAU provided their own RIB (Rigid Inflatable Boat), which tied up next to the Keary each day and excavated the wreck through use of a suction-dredger. The material removed from the site was fed to a sieve aboard the RIB, where a team of archaeologists sifted through the sand and mud to recover any small objects of interest that were removed by the dredger. All recovered objects were then moved to the Keary for analysis and storage.


Archaeologist on surface-supplied air, operating suction dredger (Photo courtesy of the Underwater Archaeology Unit)


Archaeologists aboard the UAU RIB, sieving through material suction-dredged from the wreck below.


Stern of the Rutlant Island Wreck. The metal grid was assembled on the seafloor by divers to assist with mapping of the wreck's timbers and artefacts (Photo courtesy of the Underwater Archaeology Unit)


Diver recording rope and barrel hoops exposed during the excavation


Artefacts recovered from the wreck, clockwise from top: bowl, shot, stone object and walnut shell (Photo courtesy of the Underwater Archaeology Unit)


Independently, RV Geo carried out sidescan sonar surveys of the wreck, along with expanding INFOMAR coverage of the surrounding area’s bathymetry (water depths) – the areas mapped by the Geo included several approach channels that are vital for navigation to and from the island of Arranmore, along with a sector near Lahan Island that had only been partially mapped during the days of the British Admiralty surveys.


The Geo's presence in the area allowed the team to progress INFOMAR seabed mapping while the Keary dedicated itself to the archaeological work, demonstrating once again the flexibility and efficiency that are gained by having both vessels operating together on site. The Geo's interferometer mapping system, which works like a Sidescan sonar, produced valuable imagery of the Rutland Island wreck that will be useful for further archaeological studies.


Sidescan Sonar image of the Rutland Island Wreck. The stern of the vessel is to the right (East). Note the pale shadow cast southwards by the metal grid (colours on Sidescan imagery are inverted here, with pale colours representing sonar shadow)


Total bathymetry mapped by RV Geo during the excavation


Area mapped by Geo near Lahan Island - this area was not completely mapped during the original surveys by the British Admiralty


Bathymetry mapped by RV Geo east and south of Rutland Island, including the wreck site


Shipping channel between Arranmore and Burtonport mapped by RV Geo

Thursday 29 September 2011

INFOMAR mapping of the Shannon estuary

INFOMAR mapping of the river Shannon commenced onboard the Marine Institute’s research vessel Celtic Voyager on July 19th. Over the course of the two-week survey leg, the estuary mouth was mapped up to the 10m contour, with physical sampling taking place at key locations in order to determine the seabed type (e.g. rock, sand, shell hash etc). The new seabed coverage was merged with existing datasets offshore and upriver. In addition to the geological mapping, a detailed survey was carried out over the wreck of the S.S. Premier – a British cargo steamer that was lost in 1898. This 54m long wreck lies upriver from the survey area, in a general water depth of 21m.


An overview of the survey area at the mouth of the Shannon estuary showing the newly acquired bathymetric data. The solid-colour areas indicate the extent of previous survey work.

The survey area is particularly important for a number of reasons – not only does the area incorporate a busy shipping channel, it is a Special Area of Conservation (SAC) for resident bottlenose dolphins, and from a geological perspective it overlies an important subterranean structure called the Iapetus Suture Zone – a large seam running through Ireland’s ancient bedrock that marks the closing of an ocean pre-dating the Atlantic by many millions of years.


The survey comprised bathymetric mapping of the seafloor from Kerry Head to Loop Head, with the inner extent lying along the 10m contour. As the area is an SAC for resident dolphins, the acoustic surveying took place during daylight hours only, with seabed sampling operations taking place at night. The sampling was carried out with a mechanical instrument called a “Shipek Grab” – this is a spring-loaded device that, upon being lowered to the seafloor, snaps closed and scoops up a bucket of material. Along with a variety of sediment types, the grab also returned a host of interesting biological specimens – squat lobsters, brittle stars, shrimp, crabs and solitary corals – all of which were logged before being returned safely to the sea.
In addition to the seabed mapping and sampling work, two survey lines were run at night outside the SAC, using a towed “Sparker” system to record a sub-bottom profile of the seabed sediments and bedrock. This device uses an electrical arc to create an acoustic pulse that penetrates the seabed. Where the bedrock is buried beneath soft sediments, this pulse can return a detailed image of the sediment layers and provide information on their thickness.
A variety of interesting seabed features were mapped in detail, and are detailed in the following images. Note that the colour scale represents depth, from deeper (blue) to shallower (red):


Outcrop of folded bedrock off Inishaboy Point, Co Kerry.


Shaded relief bathymetry indicates a channel feature visible in rocky seabed lying north of Kerry Head.
Distinctive layers of limestone off Horse Island, Co Clare.
Folded and faulted bedrock off Loop Head. A 3D multibeam image of the S.S. Premier wreck showing the hull of the vessel lying in a general water depth of 21m.


Multibeam echosounder image of the S.S. Premier in plan view.

Thursday 4 August 2011

INFOMAR marine geologist describes unique discoveries after returning from the Mid-Atlantic Ridge

Marine geologist Maria Judge based at the Geological Survey of Ireland, reviews data onboard.

The VENTuRE Cruise: Researching and Recovering information from the deep.
As we traversed closer to our destination, the vast grey sea turned a deep sky blue, reflecting mellow sun on a calm day. Onboard the scientists and crew, glistening with excitement, have remained calm and focused on the task at hand: that delicate task of locating hydrothermal vents up to 3000m below this vast ocean expanse.


(Top) The ships crew recover the CTD rosette to the deck. (Below) CTD data received in real-time indicates target locations for the ROV dives.


With the weather on our side, we began the science of locating a sulphide 'plume', as plumes of 'smokey' water are consistently expelled from hydrothermal Vents. For this we use a CTD rosette, guided through the water column at a quarter of a knot in a yoyo motion, during a procedure called Tow-Yo CTDing. Heads were scratched as directions and methodologies were teased out. Finally, as one small pink line deviated across a graph followed closely by the blue line, any tension and risk of not uncovering a signal was quenched! The pink line represents the Eh signal, the blue, temperature. A negative deviation in Eh is indicative of intercepting a layer of seawater containing traces of hydrothermal vent fluid. Our graph is essentially the measure of redox potential, found where fluid rich in hydrogen sulphide mixes with seawater. We look for large anomalies that indicate a strong signal, the strength of the signals represent our proximity to a vent site. When a deflection in Eh is coincident with a temperature increase we can be sure we have located a 'hot spot' close to the vent site. Considering pressure at 3000m, the fluid emitted directly from the vents are roughly ~350°C, this instantly diffusing to ~5°C a few meters from the vent as it mixes with cold sea water, beyond this the background temperature decreases to ~3°C.


After forty hours of CTD sampling, hunting Eh and concurrent temperature signals it appeared as though we had a possible plume signal boxed in. The ROV was deployed in reconnaissance mode, for this we chose a traverse to image. Rigged with a full suite of cameras recording continuously, the ROV has an aft facing camera, a downward facing camera, a forward facing camera and a High Definition camera also facing forward. Most scientists on board are accustomed to vent exploration and as such have enormous regard for the exceptionally unique and incredibly beautiful environment, so once the ROV was close to the bottom, grand excitement had engulfed the scientists on watch. Data management and logging tasks became increasingly difficult under the whirlwind of nervous suspense.
Feeling sick with anticipation, the day watch team had their gaze fixed on a monitor positioned in the now silent science lab. Hanging on to the edge of our chairs, we first spotted the trace of smoke in the water, as powerful lights and lasers on the ROV caught glittering sulphide particles and black soot in the water column. After some foggy navigation through smoky water, elegant columnar chimneys emerged into view. News travelled throughout the ship like electricity; soon the science lab was giddy with animated chatter.
Pilots steer the ROV along the vent target as scientists observe the real-time video in the ROV control cabin.

With the diligent and ever so patient ROV crew carefully navigating through the challenging terrain of the vent field, and a full compliment of scientist fully concentrating on the TV monitors, it was not long before we had a good handle on the main attributes of the vent field. Bellowing black smoke, these rust colored chimney structures have the capability of supporting a community of florescence microbial mats, shell fish, fish, crabs, shrimp and tube worms. Such fauna live solely on the sulphide-rich fluids emitted from the hydrothermal vents. These are one of very few environments in the world that do not rely on any photosynthesis to generate or sustain its community. Hence the significance to the biologists on board, who are keen to compare life around the vent to that already described at other sites.
The vents are also geologically significant for their precipitation of massive amounts of metals in the form of metal sulphide. Ancient ore deposits formed from past hydrothermal venting (called Volcanic Massive Sulphides), now exposed terrestrially, have been extensively mined e.g. the Troodos Ophiolite in Cyprus. Exploration for such deposits is still underway with old volcanic systems now uncovered on land targeted.
Samples are collected from the depths of the ocean by the ROV manipulator arms and stored in compartments until the ROV is recovered.

To understand the geological controls of the vent field, it is important for us to acquire information about the surrounding rock and its tectonic history. For this we first shot a high-resolution multibeam survey over the vents from the ROV. Multibeam uses sonar imaging to present a 3D view of the sea bed over a larger extent than we can image with our cameras. The vents here have an unusual and dramatic setting: perched on the face of a near vertical cliff scarp almost 200m high, they are unique amongst the 210 known vent fields in the world. Such a setting makes surveys and studies of this vent field very difficult and challenging. Plus the hot water surrounding the vents distorts the sonar beams and gives false reflections in mid-water above the seafloor. Our search for more information about this part of the Mid-Atlantic spreading ridge allowed us to utilize time during bad weather when the ROV can not operate. (Top) The rock dredge was deployed to collect rock samples from the seafloor. (Below) Scientist Maria Judge examines rock samples acquired from the Mid-Atlantic Ridge.

During a window in which our ship pitched and rolled in 3m swells, we took the opportunity to drop a dredge over two previously unsampled flat topped sea mount volcanoes. The dredge is a heavy iron net that is dragged across the seafloor. It cuts through layers of soft sediment until it hits the hard rocky substrate below and drags up whatever it can dislodge along the way. By dredging these hitherto unknown volcanoes, we have gained some samples which, under more detailed scrutiny back home, will cast more light on the volcanic and magmatic processes responsible for creating such an incredibly dynamic environment.
With all Geologists, Biologists and Chemists satisfied by the samples and information acquired from the new vent discovery, we turn on our heels and speed towards the next target, the Moira Mounds. Here we are currently gathering video footage of a protected area at the Porcupine Seabight, famous for its magnificent cold-water coral habitats.
High-octane spirits among the team propelled planning, preparation and procedures toward an exciting scientific discovery and an awe-inspiring reward for all who worked on board. I feel fortunate to have worked with such an adept team. We are looking forward to sharing more details of this wonderful discovery on our return and safe docking in Cork on Thursday the 4th of August
The captain, crew and scientific team gather for a group photo after a highly successful survey.

For more on the VENTuRE cruise, please check out the Science blog spot,
UCC's student website,
And the Marine Institute website.
There is also an article in the Irish Times

Monday 25 July 2011

INFOMAR marine geologist reports from the Mid-Atlantic Ridge

The VENTuRE Cruise, Research and Rescuing information from the deep with GSI based marine geologist Maria Judge onboard.
Location: 45°28.9'N 27°44.5'W Date: 20.07.11 Time: 18:00 hrs

The R.V. Celtic Explorer at Galway docks before sailing for the Mid-Atlantic Ridge.
Holland 1 the Marine Institute's remotely operated vehicle will be used to explore the Mid-Atlantic Ridge and enhance our current knowledge of vent and seep systems.


The scientists and crew of the Venture research survey, to 45°N on Mid-Atlantic Ridge and the Irish cold-water corals of the Moira Mounds, have been onboard the R.V. Celtic Explorer since July 11th . This joint venture is lead by Andy Wheeler from University College Cork (UCC) in conjunction with the Marine Institute (MI), National Oceanographic Centre Southampton (NOC) in the United Kingdom, Geological Survey of Ireland (GSI), National University of Ireland, Galway and National Geographic Television. Our venture began by readying our equipment, including the MI's deep-diving ROV "Holland 1" and preparing protocols to handle the huge amounts of data we expect to acquire.
Our mission is highly aspirational (and ambitious); we sail on the RV Celtic Explorer to 45°N, a portion of the Mid-Atlantic Ridge, in search of Deep Hydrothermal Vents (otherwise known as Black Smokers). We intend to use the Irish ROV Holland, a deep-water remotely operated vehicle, to survey this idiosyncratic environment and its unique chemosynthetic ecosystems. This mission follows an earlier survey carried out at 45°N by NOC in 2008 which studied an Axial Volcanic Ridge and serendipitously discovered water column signatures typical of high temperature hydrothermal venting. These sparse indications were of dark smoky water, some 2600m below the sparkling blue ocean and hovering above the young volcanic ridge.
Our plan for this expedition is to actually find the source of the venting on the deep sea floor, photographically document it, make high-resolution multibeam sonar images and collect rocks and animals from the site. After this, we plan to steam back toward the Moira mounds, cold-water coral mounds in the Porcupine Seabight, to survey, video and sample these beautiful and ecologically valuable habitats.
On the 15th of July, with everyone onboard, we sailed out of a tranquil Galway Bay towards the setting sun. We passed the Galway Bay esker islands, the Aran Islands and daunting Cliffs of Moher standing proud to port and the Galway's granitic coastline framed by the dominating Dalradian metamorphic mountains of Connemara to starboard. Our sunset departure was captured on film from a helicopter by National Geographic TV who is onboard filming a documentary on our deep sea exploration. There was an air of excited anticipation on board, and some anxiety, as we had been experiencing some technical problems that cost us precious time. We were also aware that we would soon be faced with a howling North-west gale conjuring 3 to 4 metre swells.
With the technical issues solved, the mobilisation, calibration and wet tests of the CTD, underwater navigation system, the ROV, and ROV-mounted multibeam echosounder commenced. Happy with the results we steamed ahead into increasingly worsening weather that would actually average a 7m swell. As the waves grew in height and the ship rolled wildly all night, and with concern for the vessel and its expensive cargo, Denis the Captain decided to keep the vessel faced into the wind and hove-to until conditions eased enough to continue the transit. With most of the scientific team seasick, morale was low and concern increased as precious time ticked by.
Meanwhile, some scientists began to feel better, and began the analysis of previously acquired data. It was crucial at this point to constrain a target location and plan the best course of action. We started by integrating data acquired during the NOC cruise in 2008, using programs such as the 3D visualisation software Fledermaus and 2D geographic information mapping software Arc Map, where various layers of information are draped in one virtual environment. This method of display shows the topography of the ocean floor, the magnetic and sidescan imagery of the ocean floor and varying temperature and chemical signatures of the water column all in one visual space. Using our knowledge and some intuitive guess work we compared each attribute to locate the most plausible position for hydrothermal venting.
The team gathered and discussed the merits of one particular 'hot-spot' of interest; result! As a target location for the first analysis was decided. We then established the best course for our survey: to perform Tow-Yo CTD casts over the area. CTD stands for Conductivity, Temperature and Depth, these are just some of the parameters measured by this hardware. It is to be deployed over the side of the ship and moved through a section of water close to the sea floor (~3000m) by towing it in a yo-yo style we can assess the chemical signatures of the water column at varying heights. This we hoped would indicate the source where the 'buoyant plume' or 'smoke' of minerals ejected from the hydrothermal vent is located.
With the weather improving and a plan of action formed we are confidently steaming toward the target location. By first light we could be on location commencing survey.

Screen grab showing data (e.g. magnetic, sidescan and bathymetry) used to target ROV dives at the Mid-Atlantic ridge using the Holland 1 ROV.


For more on the VENTuRE cruise, please check out the Science blog spot: http://scientistsatsea.blogspot.com
And UCC's student website: http://blogs.ucc.ie/wordpress/bees

Tuesday 19 July 2011

The R.V Keary @ Waterford Tallships Festival 2011


The RV Keary, a 15m aluminium catamaran is a state-run marine research survey vessel built for and operated by the Geological Survey of Ireland (GSI). Its primary function is to provide an inshore survey capability for the national INFOMAR programme (INtegrated Mapping FOr the Sustainable Development of Ireland’s MArine Resource).

The RV Keary’s first INFOMAR survey leg of 2011 took place in Waterford Harbour, starting in mid-April and finishing in mid-June.

Click here
for more information.

The campaign focused on mapping the navigational channel in advance of the Tall Ships Festival which took place at the end of June, with mapping of the shallower areas along the river banks and shore being carried out by the GSI's 7.5m RIB, RV Geo. This was the first time that both vessels have worked in tandem.

Having successfully mapped the estuary the RV Keary was invited to participate in the Tall Ships Festival. The RV Keary was positioned in Waterford Marina beside The Revenue Commissioners customs cutter, the RCC Faire. The Keary was open to the public from Thursday afternoon June 29th until Saturday evening on July 2nd.


Seabed mapping of the estuary took place in an area west of the city's Rice Bridge to the open sea at the mouth of Waterford Harbour. Photo of RV Keary at Waterford Tallships
Visitors to the Tall Ships event were invited onboard in groups of approximately 15, and those waiting for the tour were informed of the INFOMAR programme through the display of posters outlining the history of the RV Keary and the INFOMAR programme attached to the vessel’s hull.


The tour commenced on the back deck where a brief introduction to the RV Keary, the 'Real Map of Ireland', the GSI, Marine Institute (MI), INFOMAR project and the survey acquisition systems and instrumentation was provided. Visitors were also shown the mapping tools used onboard such as the side scan sonar, the magnetometer and the grab sample equipment on the back deck and invited to ask questions on any aspect of the INFOMAR programme.

Following this, the groups were presented with an overview of the data acquired during the Waterford Harbour survey on the data processing pc. Features of interest in the data were highlighted, in particular a 60m shipwreck discovered opposite the marina in Waterford city. This vessel is believed to be the cargo ship the S.S. Harvard, dating from 1870, now embedded in a scour feature in the river bank just a kilometre from where the R.V. Keary was berthed. Also of great interest was the detailed imagery of whirlpool scours (dark blue - purple), created where the river flow meets the tide.

3D image of shipwreck SS Harvard
imagery of whirpool scours (dark blue - purple), created when the river flow meets the tide in waterford estuary
Next the group was invited to view the 'pod' which is located in the middle of the vessel between the two hulls. The pod is designed to accommodate the geophysical equipment onboard such as the single beam head, multibeam heads, chirp, USBL transceiver and SV sensor in one housing. The pod is mounted on a hydraulic ram that can raise and lower the instrumentation into and out of the water. Once the pod has been lowered into the survey position, lateral rams lock the pod in place to ensure that the system is stable and the instrumentation is in the same position each time the pod is moved.

Finally, a tour of the bridge and its instrumentation was provided. The Navigation and Communication Equipment was explained including the POS MV (GPS technology) which logs all motion information in space and time, allowing the removal of the vessels motion from the sonar and shallow seismic datasets. Also, the forward looking sonar which provides information about the nature and depth of the seabed ahead of the Keary and the auto pilot steering of survey lines. A 3D fly-through of Waterford Harbour on display generated huge interest with visitors receiving a 3D visual of the seabed of Waterford harbour.

To the delight of the visitors onboard, RV Keary and Real Map of Ireland postcards were distributed along with copies of Inshore Ireland ( with Keary articles), and information on the copper coast geopark project and Marine Institute, not forgetting our younger visitors, the kiddies who received lollipops! The visitors were then free to explore the front deck of the vessel and take photographs.

Over 1,000 people came onboard to visit the RV Keary on guided tours over the three days and the positive feedback and interest in the INFOMAR programme and the data being acquired was exceptional.

On the final day of a highly successful Tall Ships event, the RV Keary participated in the 'Parade of Sails' on Sunday 3rd July. The parade was led by the naval vessel the L.E. Aoife, followed by the RCC Faire with the RV Keary in third position ahead of the biggest tallship the Russian owned 'Mir' and the remainder of the Tall Ships fleet.

Visit our Flickr site for more photos.

Le Aoife leads the parade of sails
Russian Tallship Mir following the RV Keary
Le Aoife and RCC Faire lead the Parade of Sails
Tallships in Waterford Marina
Colombian Tallship Gloria
Polish Tallship Polgoria